Console gaming statistics in 2026 show a platform segment that remains massive on revenue and engagement, even as growth rates fluctuate by release cycles, hardware refreshes, and shifting monetization (digital downloads, subscriptions, and live services).
This article compiles the most useful console gaming statistics for market size, console gaming revenue, console player counts, and major platform install bases (PlayStation, Nintendo, and Xbox).
Top Console Gaming Statistics (2026 Snapshot)
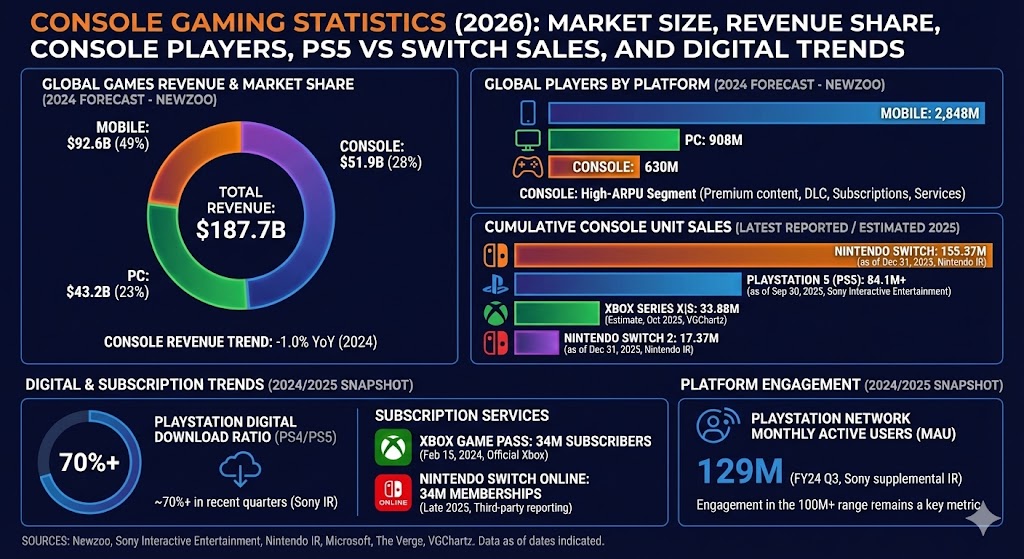
- Console gaming revenue (global): $51.9B for 2024 (Newzoo forecast for 2024), representing roughly 28% of total global games revenue.
- Total global games revenue (all platforms): $187.7B for 2024 (Newzoo forecast).
- Console players worldwide: 630M in 2024 (Newzoo forecast).
- PS5 cumulative hardware sales: 84.1M+ units (as of Sep 30, 2025, Sony Interactive Entertainment).
- Nintendo Switch cumulative hardware sales: 155.37M units (as of Dec 31, 2025, Nintendo IR).
- Nintendo Switch 2 cumulative hardware sales: 17.37M units (as of Dec 31, 2025, Nintendo IR).
- Xbox Game Pass subscribers (officially reported): 34M (Microsoft, disclosed Feb 15, 2024 via official Xbox podcast reporting covered by The Verge).
- PlayStation Network monthly active users (MAU): Sony reports quarterly MAU; for example 129M in FY24 Q3 (Sony supplemental IR materials).
- PlayStation full game software digital download ratio: Sony reports quarterly digital ratios (often ~70%+ across PS4/PS5 combined in recent quarters in its supplemental IR materials).
Console Gaming Market Size Statistics: Revenue, Share, and Growth
When people search for console gaming statistics, the first question is usually market size. Newzoo’s global games market forecast for 2024 puts total industry revenue at $187.7B, split into three primary segments: mobile, console, and PC.
Global Games Revenue by Segment (2024 Forecast)
| Segment | 2024 Revenue (USD) | Share of Total | YoY Trend (2024) |
|---|---|---|---|
| Mobile | $92.6B | ~49% | +3.0% |
| Console | $51.9B | ~28% | -1.0% |
| PC | $43.2B | ~23% | +4.0% |
| Total | $187.7B | 100% | +2.1% |
Why these console gaming statistics matter: even in a “flat” year, console gaming represents tens of billions of dollars—large enough that release calendars (blockbusters, first-party waves, and major live-service updates) can visibly swing the segment’s growth rate.
Chart: 2024 Revenue by Segment (Console vs PC vs Mobile)
Console Player Statistics: How Many Console Gamers Are There?
Beyond revenue, console gaming statistics often focus on reach. Newzoo’s forecast places console players at 630M globally in 2024. That’s a huge audience base, and it helps explain why cross-platform titles and “evergreen” live-service releases invest heavily in console optimization and controller-first UX.
- Console players (2024): 630M
- PC players (2024): 908M
- Mobile players (2024): 2,848M
These console gaming statistics also clarify why major publishers treat console as a “high-ARPU” segment: consoles can be smaller than mobile in total headcount, while still delivering outsized revenue per paying user via premium content, DLC, cosmetics, subscriptions, and platform services.
Console Sales Statistics: PS5 vs Nintendo Switch vs Xbox Series
Hardware install base remains one of the most searched console gaming statistics categories, because install base strongly correlates with software sales potential, subscription attach rates, and long-term monetization.
Major Console Install Base (Selected Official Metrics)
| Console | Cumulative Units (latest reported) | As-of Date | Source Type |
|---|---|---|---|
| PlayStation 5 (PS5) | 84.1M+ | Sep 30, 2025 | Official (Sony Interactive Entertainment) |
| Nintendo Switch | 155.37M | Dec 31, 2025 | Official (Nintendo IR) |
| Nintendo Switch 2 | 17.37M | Dec 31, 2025 | Official (Nintendo IR) |
| Xbox Series X|S | 33.88M (estimate) | Oct 2025 (tracking month) | Estimate (VGChartz; Microsoft does not regularly disclose) |
Chart: Console Install Base Comparison (Latest Reported / Estimated)
Two key takeaways from these console gaming statistics:
- Legacy install base still matters: Switch’s cumulative install base illustrates how long lifecycle momentum can persist (and why publishers keep shipping late-generation ports).
- Disclosure differences shape “market share” debates: Sony and Nintendo regularly publish unit totals; Microsoft often does not—so third-party estimates are frequently used for Xbox hardware comparisons.
Digital Console Gaming Statistics: Download Ratio, MAU, and Subscriptions
Modern console gaming statistics aren’t just about discs and boxes. Platforms now compete on engagement metrics (monthly active users), digital purchasing behavior, and subscription ecosystems.
PlayStation engagement: monthly active users (MAU)
Sony reports PlayStation Network monthly active users (MAU) in quarterly supplemental materials. A frequently cited data point from those materials shows MAU in the 100M+ range, including a reported 129M MAU in one FY24 quarter (end-of-quarter reporting).
PlayStation digital download ratio
Sony also reports a “full game software digital download ratio” for PS4/PS5 combined, commonly landing around ~70%+ in recent quarters. That means the majority of full-game purchases are increasingly digital—one of the most important console gaming statistics for forecasting retail trends and platform margin dynamics.
Console subscription statistics: Game Pass and Nintendo Switch Online
- Xbox Game Pass subscribers (official): Microsoft disclosed 34M subscribers in February 2024 (widely reported based on Microsoft’s official Xbox podcast update).
- Nintendo Switch Online memberships: Third-party reporting in late 2025 cites 34M active memberships (note: Nintendo’s exact membership disclosures can vary by reporting format and period).
These console gaming statistics highlight how recurring revenue models (subscriptions + services) sit alongside premium sales, live-service monetization, and first-party release cycles.
Console Gaming Statistics FAQ
How big is the console gaming market?
Newzoo’s forecast for 2024 places console gaming revenue at $51.9B, about 28% of the $187.7B global games market.
How many console gamers are there worldwide?
Newzoo forecasts 630M console players globally in 2024.
Which console has sold the most units recently?
By cumulative units, Nintendo reports the Switch at 155.37M units as of Dec 31, 2025. Sony reports PS5 at 84.1M+ as of Sep 30, 2025.
What’s the most important digital console gaming statistic to track?
For monetization and platform strategy, digital purchase behavior is crucial—Sony’s reported full game software digital download ratio (often around ~70%+) is one of the most practical console gaming statistics for understanding where the market is headed.
References (Exact URLs)
- Newzoo – 2024 Global Games Market Report (PDF): https://best-of-gaming.be/wp-content/uploads/2024/09/2024_Newzoo_Global_Games_Market_Report.pdf
- Newzoo – Global Games Market Report 2024 (free version landing page): https://newzoo.com/resources/trend-reports/newzoos-global-games-market-report-2024-free-version
- Sony Interactive Entertainment – Business Data & Sales (PS5 cumulative sales as of Sep 30, 2025): https://sonyinteractive.com/en/our-company/business-data-sales/
- Sony IR – FY24 Q3 Supplemental Information (MAU + digital download ratio tables in supplemental PDF): https://www.sony.com/en/SonyInfo/IR/library/presen/er/pdf/24q3_supplement.pdf
- Nintendo IR – Dedicated Video Game Sales Units (Switch and Switch 2 totals as of Dec 31, 2025): https://www.nintendo.co.jp/ir/en/finance/hard_soft/index.html
- The Verge – Microsoft Xbox Game Pass subscriber number (34M disclosed Feb 15, 2024): https://www.theverge.com/2024/2/15/23570040/microsoft-xbox-game-pass-subscriber-numbers-34-million
- VGChartz – Xbox Series vs Xbox One Sales Comparison (includes Xbox Series X|S estimate as of Oct 2025 tracking month): https://www.vgchartz.com/article/466346/xbox-series-vs-xbox-one-sales-comparison-october-2025/