“Sports game statistics” can mean anything from how long games last, to how much scoring fans see, to how packed stadiums are. Below is a data-first snapshot across major leagues (NFL, MLB, NBA, NHL, and the Premier League), using the latest full seasons available from official releases and major statistical summaries.
sports game statistics
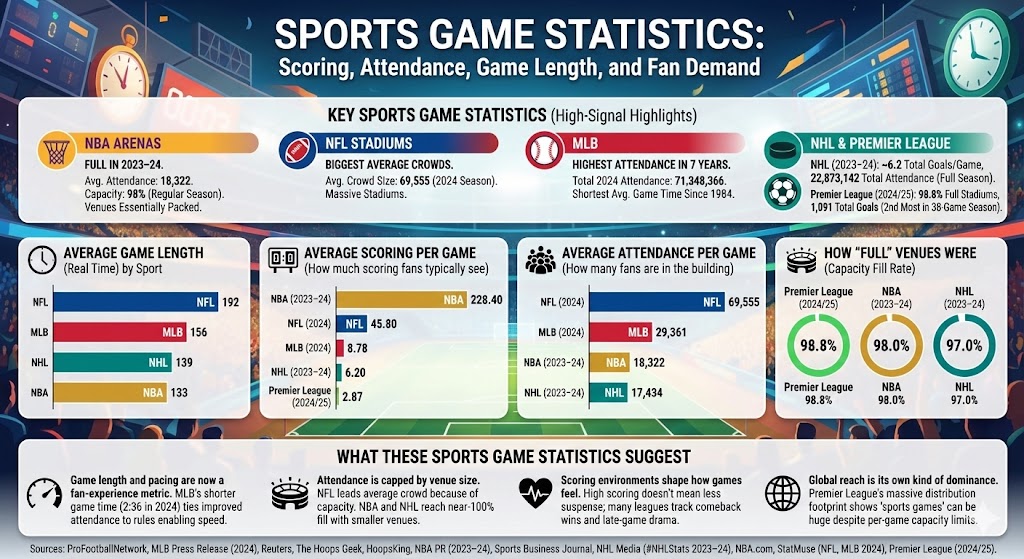
Key sports game statistics (high-signal highlights)
NBA arenas were essentially full in 2023–24, with an announced average attendance of 18,322 and 98% capacity (regular season).
NFL stadiums are the biggest by average crowd size, with an average of 69,555 per game (2024 season).
MLB’s 2024 total attendance was 71,348,366, its highest in seven years (and it also cited the shortest average game time since 1984).
NHL’s 2023–24 regular season averaged about 6.2 total goals per game, and the league’s total attendance reached 22,873,142 across a full 1,312-game schedule.
Premier League stadiums were 98.8% full in 2024/25, and the season produced 1,091 total goals (the second-most of any 38-game season, per the league’s own “season in numbers” recap).
Average game length (real time) by sport
These are “how long it takes to watch the game” estimates, not the on-clock playing time.
League/Sport
Bar
Avg. Game Length (minutes)
NFL
192
MLB
156
NHL
139
NBA
133
Max = 192. Widths: NFL 100.00%, MLB 81.25%, NHL 72.40%, NBA 69.27%.
Average scoring per game (how much scoring fans typically see)
Because sports use different scoring units (points vs. goals vs. runs), the most apples-to-apples approach is to compare total scoring per game (both teams combined) within each sport. This shows why some sports feel “high scoring” even when outcomes are still close.
League
Bar
Avg. Total Points/Goals/Runs per Game
NBA (2023–24)
228.40
NFL (2024)
45.80
MLB (2024)
8.78
NHL (2023–24)
6.20
Premier League (2024/25)
2.87
Max = 228.40. Widths: NBA (2023–24) 100.00%, NFL (2024) 20.05%, MLB (2024) 3.84%, NHL (2023–24) 2.71%, Premier League (2024/25) 1.26%.
Average attendance per game (how many fans are in the building)
This compares average in-person attendance per game for major North American leagues, using season totals and announced league averages.
League
Bar
Avg. Attendance per Game
NFL (2024)
69,555
MLB (2024)
29,361
NBA (2023–24)
18,322
NHL (2023–24)
17,434
Max = 69,555. Widths: NFL (2024) 100.00%, MLB (2024) 42.21%, NBA (2023–24) 26.34%, NHL (2023–24) 25.07%.
How “full” venues were (capacity fill rate)
Sellouts and near-sellouts matter because they capture demand even when venues are capacity constrained.
League
Bar
Percent of Capacity
Premier League (2024/25)
98.8%
NBA (2023–24)
98.0%
NHL (2023–24)
97.0%
Max = 98.8%. Widths: Premier League (2024/25) 100.00%, NBA (2023–24) 99.19%, NHL (2023–24) 98.18%.
What these sports game statistics suggest
Game length and pacing are now a fan-experience metric. MLB’s shorter average game time in 2024 (2:36) is part of why the league tied improved attendance to rules designed to speed up play.
Attendance is capped by venue size. The NFL leads average attendance because of stadium capacity. The NBA and NHL can still be “maxed out” (near-100% fill) with smaller venues.
Scoring environments shape how games feel. Higher scoring doesn’t automatically mean less suspense; many leagues track comeback wins and late-game scoring as “drama” indicators.
Global reach is its own kind of dominance. The Premier League’s distribution footprint (countries, homes, followers) shows how “sports games” can be massive even when per-game attendance is naturally capped by stadium size.
Sources
ProFootballNetwork – Average NFL game length: https://www.profootballnetwork.com/how-long-is-a-football-game/
Reuters (MLB average game time 2:36 and attendance context): https://www.reuters.com/sports/baseball/mlb-says-rule-changes-driving-attendance-up-2024-10-01/
The Hoops Geek – Average NBA game length (real time): https://www.thehoopsgeek.com/average-nba-game-length/
HoopsKing – Typical NHL game length estimate: https://hoopsking.com/blogs/hoopsking-com/how-long-are-hockey-games-the-ultimate-guide-to-game-duration
NBA PR (attendance + capacity for 2023–24): https://pr.nba.com/nba-attendance-records-2023-24-regular-season/
Sports Business Journal – NFL average crowd size (2024): https://www.sportsbusinessjournal.com/Articles/2025/01/09/Football/nfl-attendance-figure-2024/
NHL Media – #NHLStats Pack 2023–24 Regular Season Recap (goals per game + final attendance total): https://media.nhl.com/public/news/17943
NBA.com – league average points per game context (used for scoring math): https://www.nba.com/news/nba-league-average-points-per-game-stats-final-february-2024
StatMuse – NFL league average points per game (2024): https://www.statmuse.com/nfl/ask?q=nfl+league+average+points+per+game+2024
StatMuse – MLB league average runs per game (AL/NL totals used for weighted 2024 average): https://www.statmuse.com/mlb/ask?q=mlb+league+average+runs+per+game+2024
Premier League – 2024/25 season in numbers (goals total + 98.8% full + distribution stats): https://www.premierleague.com/en/news/4316617