Mobile gaming statistics keep proving one thing: mobile games are still the biggest slice of gaming by revenue and the biggest engine of game downloads worldwide.
mobile gaming statistics
Below is a statistics-heavy breakdown of mobile gaming statistics covering mobile gaming revenue, mobile game downloads, mobile game consumer spend, and the most important genre-level mobile gaming statistics for marketers, developers, and publishers.
Mobile Gaming Statistics (Top Highlights)
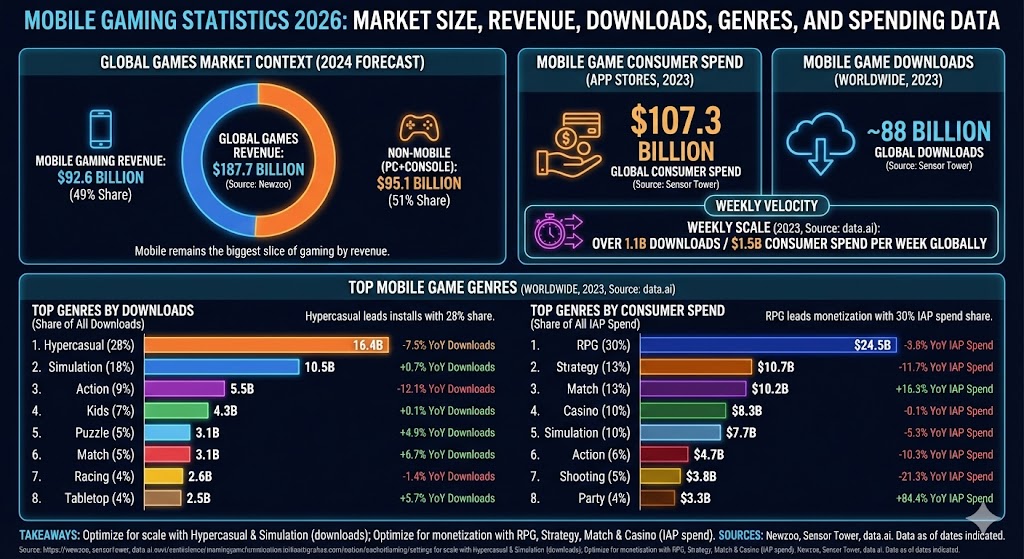
Mobile gaming revenue (Newzoo): Mobile gaming is projected to reach $92.6 billion in 2024, representing 49% of global games revenue. (Newzoo)
Global games market context: The global games market is estimated at $187.7 billion in 2024. (Newzoo)
Mobile game consumer spend (app stores): Global consumer spend in mobile games was $107.3 billion in 2023. (Sensor Tower)
Mobile game downloads: Mobile game downloads fell to nearly 88 billion in 2023. (Sensor Tower)
Weekly scale (downloads + spend): In 2023, players averaged over 1.1B downloads and $1.5B consumer spend per week on mobile games globally. (data.ai)
Top genre by downloads:Hypercasual led 2023 with 16.4B downloads and 28% share of downloads. (data.ai)
Top genre by IAP spend:RPG led 2023 with $24.5B in (IAP) spend and 30% share of IAP spend. (data.ai)
Mobile Gaming Market Size Statistics (Revenue + Spending)
When people search for mobile gaming statistics, they usually want a clean answer to “how big is mobile gaming?” The truth is: different measurement systems produce different “mobile gaming market size” numbers depending on what is included (app-store IAP only vs. broader definitions).
Table: Mobile Gaming Market Size Statistics (Revenue vs. App-Store Spend)
Metric
Value
Year
What it represents
Mobile gaming revenue (share of global games)
$92.6B (and 49% of global games revenue)
2024
Newzoo estimate of mobile segment revenue within total games market
Global games market revenue
$187.7B
2024
Total games market (all platforms)
Mobile game consumer spend (app stores)
$107.3B
2023
Consumer spend tracked across major app stores (methodology differs from market-sizing)
Mobile game downloads
~88B
2023
Annual downloads across the app ecosystem (Sensor Tower estimate)
Chart: Mobile Gaming Revenue Share (Mobile vs. Non-Mobile)
Label
Bar
Value
Mobile
49%
Non-mobile (PC+Console)
51%
Max = 51%. Widths: Mobile 96.08%, Non-mobile (PC+Console) 100.00%. Mobile games revenue: $92.6B out of $187.7B total.
Mobile Game Downloads Statistics (What People Install)
Mobile gaming statistics around downloads matter because installs set the ceiling for monetization. In 2023, mobile game downloads declined to nearly 88 billion globally (Sensor Tower). At the genre level, downloads are dominated by ultra-broad, mass-market categories (especially hypercasual).
Table: Top Mobile Game Genres by Downloads (Worldwide, 2023)
These mobile gaming statistics come from data.ai’s worldwide breakdown of top mobile game genres by downloads in 2023.
Rank
Genre
Downloads
Share of All Downloads
YoY Downloads
Share of All IAP Spend (context)
1
Hypercasual
16.4B
28%
-7.5%
0.5%
2
Simulation
10.5B
18%
+0.7%
9.5%
3
Action
5.5B
9%
-12.1%
5.8%
4
Kids
4.3B
7%
+0.1%
0.7%
5
Puzzle
3.1B
5%
+4.9%
1.6%
6
Match
3.1B
5%
+6.7%
12.6%
7
Racing
2.6B
4%
-1.4%
0.8%
8
Tabletop
2.5B
4%
+5.7%
2.0%
Chart: Top Mobile Game Genres by Downloads (2023)
Label
Bar
Value
Hypercasual
16.4B
Simulation
10.5B
Action
5.5B
Kids
4.3B
Puzzle
3.1B
Match
3.1B
Racing
2.6B
Tabletop
2.5B
Max = 16.4B. Widths: Hypercasual 100.00%, Simulation 64.02%, Action 33.54%, Kids 26.22%, Puzzle 18.90%, Match 18.90%, Racing 15.85%, Tabletop 15.24%.
Table: Top Mobile Game Genres by Consumer Spend (Worldwide, 2023)
Rank
Genre
(IAP) Spend
Share of All IAP Spend
YoY IAP Spend
Share of All Downloads (context)
1
RPG
$24.5B
30%
-3.8%
3%
2
Strategy
$10.7B
13%
-11.7%
2%
3
Match
$10.2B
13%
+16.3%
5%
4
Casino
$8.3B
10%
-0.1%
3%
5
Simulation
$7.7B
10%
-5.3%
18%
6
Action
$4.7B
6%
-10.3%
9%
7
Shooting
$3.8B
5%
-21.3%
4%
8
Party
$3.3B
4%
+84.4%
2%
Chart: Top Mobile Game Genres by IAP Spend (2023)
This chart shows why “high-spend genres” are the most important mobile gaming statistics categories for monetization strategy.
Chart: Top Mobile Game Genres by IAP Spend (2023)
Label
Bar
Value
RPG
$24.5B
Strategy
$10.7B
Match
$10.2B
Casino
$8.3B
Simulation
$7.7B
Action
$4.7B
Shooting
$3.8B
Party
$3.3B
Max = $24.5B. Widths: RPG 100.00%, Strategy 43.67%, Match 41.63%, Casino 33.88%, Simulation 31.43%, Action 19.18%, Shooting 15.51%, Party 13.47%.
Mobile Gaming Engagement Statistics (Weekly Scale)
One of the most practical mobile gaming statistics lenses is “weekly velocity.” data.ai reports that in 2023, mobile games averaged over 1.1B downloads and $1.5B in consumer spend per week globally. That’s a strong reminder that mobile gaming is not just big annually—it is big every single week.
Quick Weekly Mobile Gaming Statistics (2023)
Over 1.1B downloads per week (global mobile games)
$1.5B consumer spend per week (global mobile games)
What These Mobile Gaming Statistics Mean for Growth
If you optimize for scale: Hypercasual and Simulation dominate installs (download-first growth loops).
If you optimize for monetization: RPG, Strategy, Match, and Casino dominate IAP spend share (spend-first retention loops).
If you need investor-ready sizing: Use market-sizing estimates (e.g., mobile gaming revenue share of total games revenue) and keep app-store spend numbers as a separate “consumer spend” line item.
Mobile Gaming Statistics FAQ
What is the total mobile gaming market size?
One widely cited market-sizing estimate is that mobile gaming revenue is $92.6B in 2024 and equals 49% of global games revenue (Newzoo). App-store “consumer spend” tracking can produce different totals (for example, $107.3B consumer spend in 2023 according to Sensor Tower), so it’s best to label the metric clearly as “market revenue” vs. “app-store consumer spend.”
How many mobile game downloads happen each year?
Sensor Tower reports that mobile game downloads fell to nearly 88 billion in 2023. These mobile gaming statistics highlight how massive the install funnel still is, even when the market cools from peak pandemic years.
Which mobile game genre gets the most downloads?
In worldwide mobile gaming statistics for 2023, data.ai reports Hypercasual ranked #1 by downloads with 16.4B downloads and 28% share of downloads.
Which mobile game genre makes the most money from IAP?
In worldwide mobile gaming statistics for 2023, data.ai reports RPG ranked #1 by consumer spend with $24.5B in (IAP) spend and 30% share of all IAP spend.
Sources (Exact URLs)
Newzoo (Global games market revenue + mobile share and mobile revenue): https://newzoo.com/resources/blog/global-games-market-revenue-estimates-and-forecasts-in-2024
Sensor Tower (State of Mobile Gaming 2024: 2023 mobile game spend $107.3B and downloads ~88B): https://sensortower.com/blog/state-of-mobile-gaming-2024
Sensor Tower (State of Mobile Gaming 2024 landing page mention of $107.3B and ~63% of app-store spend): https://sensortower.com/state-of-mobile-gaming-2024
data.ai (State of Mobile 2024 PDF used for weekly downloads/spend + genre download & spend breakdowns): https://mediaculture.fr/wp-content/uploads/2024/10/Usages-mobile-2024-datai-compresse.pdf