Video game addiction statistics are most often reported using clinical frameworks like Gaming Disorder (ICD-11) and Internet Gaming Disorder (DSM-5/DSM-5-TR condition for further study). Because definitions, screening tools, and sampling methods vary, video game addiction prevalence can look very different across studies, age groups, and countries.
This 2026-ready roundup compiles the most-cited, research-backed video game addiction statistics—with extra focus on pooled prevalence meta-analyses, young adult risk rates, and real-world treatment referral data.
Top Video Game Addiction Statistics (Quick Facts)
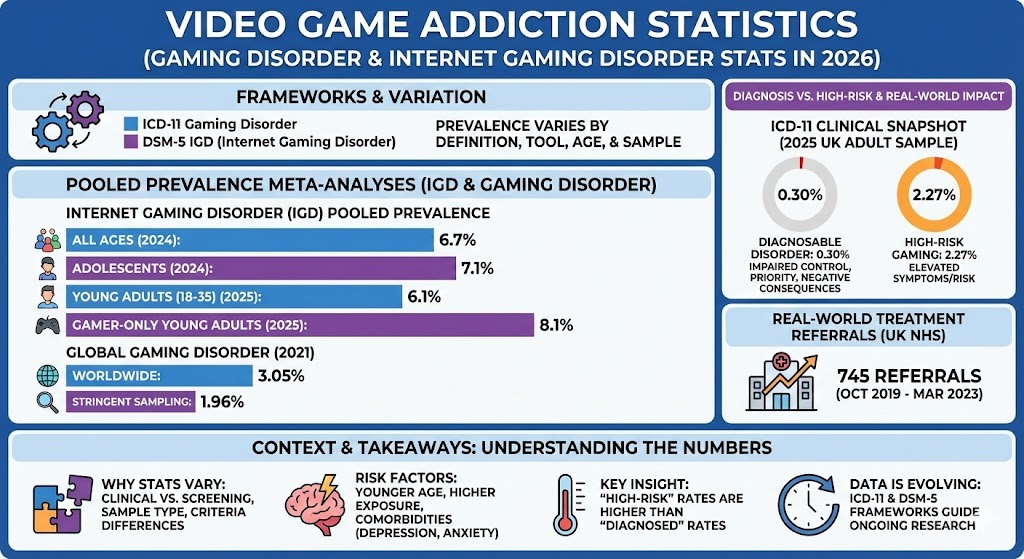
- 6.7% pooled prevalence of Internet Gaming Disorder (IGD) across studies in a 2024 meta-analysis (DSM-5 & ICD-11 related evidence base).
- 7.1% pooled prevalence of IGD among adolescents in the same 2024 meta-analysis.
- 6.1% pooled prevalence of IGD among young adults (18–35) in a 2025 systematic review and meta-analysis (nearly 150,000 participants).
- In gamer-only samples of young adults, pooled IGD prevalence rises to 8.1% (2025 meta-analysis).
- A 2021 global meta-analysis estimated worldwide gaming disorder prevalence at 3.05%, and 1.96% when restricted to more stringent sampling methods.
- In a nationally representative British adult sample (ICD-11 framework), gaming disorder prevalence was reported at 0.30%, while high-risk gaming was 2.27% (2025 study).
- The UK’s NHS reported 745 referrals to its National Centre for Gaming Disorders from October 2019 to March 2023.
Video Game Addiction Statistics: Prevalence Rates (Global Estimates)
When people search for “video game addiction statistics,” they typically want a single prevalence number. The best-supported answer is: there isn’t one universal rate. Estimates depend on:
- Diagnostic criteria (ICD-11 Gaming Disorder vs DSM-5 IGD criteria)
- Who is surveyed (general population vs gamers only)
- Age group (adolescents vs young adults vs older adults)
- Measurement tool (clinical interviews vs self-report screening scales)
- Sampling quality (nationally representative vs convenience samples)
Table: Video Game Addiction Prevalence Statistics by Major Research Source
| Study / Source | Population | Metric Used | Key Video Game Addiction Statistics | Notes (Why It Matters) |
|---|---|---|---|---|
| 2024 meta-analysis (IGD prevalence) | Mixed (adolescents + adults across multiple studies) | Internet Gaming Disorder (IGD) | 6.7% pooled IGD prevalence; 7.1% adolescents; 6.5% adults | Strong “big-picture” pooled estimate; highlights variation by criteria and sampling. |
| 2025 systematic review & meta-analysis (young adults) | Young adults (18–35), 149,601 participants | Internet Gaming Disorder (IGD) | 6.1% pooled IGD prevalence; 8.1% in gamer-only samples; 5.47% in mixed samples | Separates gamer-only vs mixed samples, showing how prevalence rises when you only survey gamers. |
| 2021 global meta-analysis (gaming disorder) | Worldwide (multi-study synthesis) | Gaming Disorder | 3.05% global prevalence; 1.96% when limited to more stringent sampling | Shows how prevalence drops when analysis prioritizes stronger sampling methods. |
| 2025 nationally representative British adult sample | British adults (nationally representative sample) | Gaming Disorder (ICD-11) | 0.30% gaming disorder; 2.27% high-risk gaming | Illustrates the difference between “diagnosable disorder” vs “high-risk” patterns. |
Video Game Addiction Statistics Chart (Prevalence Comparison)
Below is a simple visual comparison of commonly cited prevalence estimates. (These figures are not directly comparable clinically; they reflect different definitions and samples.)
| Label | Bar | Value | ||
|---|---|---|---|---|
| Global Gaming Disorder (meta-analysis) |
|
3.05% | ||
| IGD pooled prevalence (meta-analysis) |
|
6.7% | ||
| IGD adolescents (meta-analysis) |
|
7.1% | ||
| IGD young adults (meta-analysis) |
|
6.1% | ||
| IGD young adults (gamer-only) |
|
8.1% |
Max = 8.1%. Widths: Global Gaming Disorder (meta-analysis) 37.65%, IGD pooled prevalence (meta-analysis) 82.72%, IGD adolescents (meta-analysis) 87.65%, IGD young adults (meta-analysis) 75.31%, IGD young adults (gamer-only) 100.00%.
ICD-11 Gaming Disorder Statistics: What Counts as “Video Game Addiction” Clinically?
The World Health Organization’s ICD-11 gaming disorder definition centers on a persistent pattern of gaming behavior with:
- Impaired control over gaming
- Increasing priority given to gaming over other interests and daily activities
- Continuation or escalation despite negative consequences
In many clinical framings, symptoms must be evident for a significant period (often discussed as around 12 months in common clinical summaries), and the pattern must cause meaningful impairment in personal, family, social, educational, or occupational functioning.
Video Game Addiction Statistics by Age Group
Adolescents: Higher Risk Signals in Many Datasets
Across many research summaries, video game addiction statistics show higher pooled prevalence in younger populations—especially when studies focus on school-based samples, high engagement groups, or self-report screening tools. For example, one large 2024 pooled estimate reported:
- 7.1% pooled IGD prevalence among adolescents
Young Adults (18–35): A Major High-Exposure Group
A 2025 systematic review and meta-analysis focusing on young adults estimated:
- 6.1% pooled IGD prevalence among young adults
- 8.1% pooled prevalence in gamer-only young adult samples
This pattern is important for parents, universities, and workplace health programs because “video game addiction” risk does not end after the teen years.
Video Game Addiction Treatment Statistics (Real-World Referrals)
Beyond surveys, treatment systems offer another lens into video game addiction statistics. The UK’s NHS has published referral totals for its specialist clinic.
Table: UK NHS Gaming Disorder Clinic Referral Statistics
| Country / System | Clinic / Data Source | Time Period | Published Treatment Demand Statistic | Interpretation |
|---|---|---|---|---|
| United Kingdom | NHS England / National Centre for Gaming Disorders | Oct 2019 – Mar 2023 | 745 people referred for treatment since clinic opening | Shows measurable clinical demand in a real healthcare pathway (not just surveys). |
| United Kingdom | Peer-reviewed write-up of the UK clinic model | Inception – Jun 2021 | 236 referrals reported in the early period | Early-stage demand signal; useful for understanding growth over time. |
Video Game Addiction Statistics: Risk Factors Commonly Linked in Research
While this article focuses on video game addiction statistics, many studies also examine correlates. Across large syntheses and clinical discussions, commonly studied associations include:
- Higher symptoms of depression, anxiety, and stress in disordered gaming groups (association patterns vary by study design).
- Higher risk estimates in samples with heavier exposure (for example, gamer-only samples vs general population samples).
- Strong methodological effects: prevalence rises when studies use smaller samples or less stringent sampling methods (a recurring finding in meta-analytic subgroup comparisons).
Why Video Game Addiction Statistics Vary So Much
If you’ve seen wildly different video game addiction prevalence numbers online (from under 1% to over 10%), there are real reasons:
- Clinical disorder vs screening risk: “high-risk gaming” rates are typically higher than “gaming disorder” diagnosis rates.
- Self-report scales inflate prevalence compared with clinical interviews in many behavioral health areas.
- Samples matter: surveys of gamers, esports communities, or heavy-play groups will almost always yield higher percentages.
- Criteria are not identical: ICD-11 gaming disorder and DSM-5 IGD are related but not interchangeable.
Video Game Addiction Statistics FAQ
What percentage of gamers are addicted (video game addiction percentage)?
Across pooled research, a commonly cited range for “Internet Gaming Disorder” prevalence is around 6%–7% in meta-analytic estimates, with higher percentages (such as ~8%) in gamer-only samples of young adults. However, strict “gaming disorder” diagnosis rates in representative adult samples can be far lower (for example, 0.30% in one nationally representative British adult sample using ICD-11 criteria).
Is gaming disorder officially recognized?
Yes. The World Health Organization includes Gaming Disorder in the ICD-11 classification system, describing impaired control, priority of gaming over other activities, and continuation despite negative consequences.
What’s the difference between “IGD” and “Gaming Disorder” in video game addiction statistics?
Internet Gaming Disorder (IGD) is commonly used in research (DSM-5 framework), while Gaming Disorder is the ICD-11 clinical classification. They overlap conceptually, but differences in criteria and measurement tools can change the reported video game addiction statistics.
References (Exact URLs)
- WHO (ICD-11) Gaming disorder definition: https://www.who.int/standards/classifications/frequently-asked-questions/gaming-disorder
- Meta-analysis of IGD prevalence (2024, MDPI): https://www.mdpi.com/1660-4601/21/6/700
- PubMed record for 2024 IGD prevalence meta-analysis: https://pubmed.ncbi.nlm.nih.gov/38928946/
- Young adults IGD systematic review & meta-analysis (2025, Addictive Behaviors): https://www.sciencedirect.com/science/article/pii/S0306460325003454
- Global prevalence of gaming disorder meta-analysis (2021, PubMed): https://pubmed.ncbi.nlm.nih.gov/33028074/
- Nationally representative British adult ICD-11 gaming disorder study (2025): https://www.sciencedirect.com/science/article/pii/S0165032725018026
- NHS England press release on gaming disorder clinic referrals (745 referrals since Oct 2019): https://www.england.nhs.uk/2023/03/nhs-treats-hundreds-with-gaming-disorders/
- UK National Centre for Gaming Disorders (clinic info): https://www.cnwl.nhs.uk/national-centre-gaming-disorders
- Peer-reviewed overview mentioning early referral totals (UK clinic): https://akjournals.com/view/journals/2006/11/2/article-p147.xml