VR gaming remains a niche compared with flat-screen gaming, but key platforms (especially Meta Quest and SteamVR) continue to evolve. The stats below highlight where VR gaming is strongest today: PC VR usage on Steam, the most-used headsets, store engagement signals, and what developers say they’re building for.
vr gaming statistics
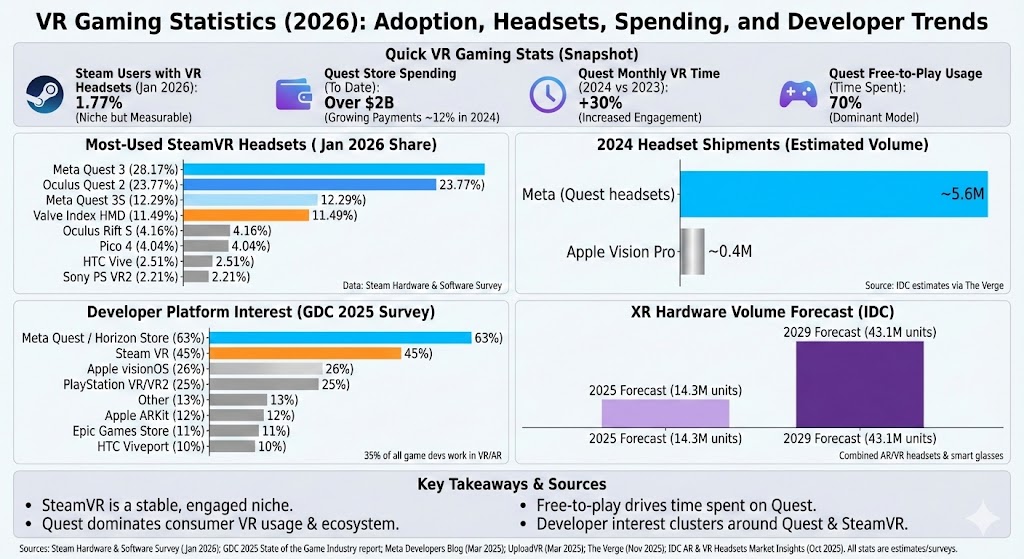
Quick VR gaming stats
Steam users with VR headsets (January 2026): 1.77%.
Most-used SteamVR headsets (January 2026): Meta Quest 3 (28.17%), Oculus Quest 2 (23.77%), Meta Quest 3S (12.29%), Valve Index HMD (11.49%).
Meta reports: over $2B spent on Quest titles to date; payments up ~12% in 2024; and customers spent 30% more monthly time in VR in 2024 vs. the prior year.
Quest usage mix: free-to-play apps account for 70% of time spent on Quest headsets.
GDC 2025 survey: 35% of all game developers work in VR/AR development; top VR/AR platform interest includes Meta Quest / Horizon Store (63%) and Steam VR (45%).
Which VR headsets SteamVR players use
The Steam Hardware & Software Survey reports headset share among Steam users who have VR headsets. In January 2026, Meta’s Quest line dominates the top spots.
Label
Bar
Value
Meta Quest 3
28.17%
Oculus Quest 2
23.77%
Meta Quest 3S
12.29%
Valve Index HMD
11.49%
Oculus Rift S
4.16%
Pico 4
4.04%
HTC Vive
2.51%
Sony PS VR2
2.21%
Max = 28.17%. Widths: Meta Quest 3 100.00%, Oculus Quest 2 84.38%, Meta Quest 3S 43.63%, Valve Index HMD 40.79%, Oculus Rift S 14.77%, Pico 4 14.34%, HTC Vive 8.91%, Sony PS VR2 7.85%.
How small is PC VR in the Steam ecosystem?
Steam’s hardware survey shows 1.77% of Steam users reported having VR headsets in January 2026. This helps explain why VR game releases tend to target highly engaged sub-communities, cross-platform launches (Quest + PC), or evergreen genres like rhythm, social, and fitness.
Headset shipments: consumer VR is still concentrated
Shipment estimates frequently show one vendor carrying most consumer volume. For example, The Verge reported (citing IDC) that Apple shipped roughly 400,000 Vision Pro units in 2024, while Meta shipped roughly 5.6 million headsets in 2024.
Label
Bar
Value
Meta (Quest headsets)
5.6M (2024)
Apple Vision Pro
0.4M (2024)
Max = 5.6M. Widths: Meta (Quest headsets) 100.00%, Apple Vision Pro 7.14%.
Quest store engagement: spending and time are rising, but behavior is shifting
Meta has pointed to rising engagement and store activity: over $2B spent on Quest titles to date, total payments up ~12% in 2024, and customers spending 30% more monthly time in VR in 2024 vs. 2023. Separately, Meta has said free-to-play apps account for 70% of time spent on Quest.
Label
Bar
Value
Time in free-to-play apps (Quest)
70%
Monthly time in VR (2024 vs 2023)
+30%
Total payments (2024 vs 2023)
+12%
Max = 70%. Widths: Time in free-to-play apps (Quest) 100.00%, Monthly time in VR (2024 vs 2023) 42.86%, Total payments (2024 vs 2023) 17.14%.
Developer momentum: where VR game makers are focusing
In the GDC 2025 State of the Game Industry report, 35% of all game developers reported working in VR/AR development. Among VR/AR developers, the most-cited platform interest leaned heavily toward Meta Quest / Horizon Store and Steam VR.
Label
Bar
Value
Meta Quest / Horizon Store
63%
Steam VR
45%
Apple visionOS
26%
PlayStation VR/VR2
25%
Other
13%
Apple ARKit
12%
Epic Games Store
11%
HTC Viveport
10%
Max = 63%. Widths: Meta Quest / Horizon Store 100.00%, Steam VR 71.43%, Apple visionOS 41.27%, PlayStation VR/VR2 39.68%, Other 20.63%, Apple ARKit 19.05%, Epic Games Store 17.46%, HTC Viveport 15.87%.
Outlook: hardware volumes and content spend point to a larger XR ecosystem
IDC forecasts worldwide shipments of AR/VR headsets combined with display-less smart glasses will reach 14.3 million units in 2025, with longer-range forecasts showing hardware volumes reaching 43.1 million in 2029. IDC also forecasts spending on apps, services, and related technologies to rise to nearly $12B in 2025.
GDC 2025 State of the Game Industry report (PDF): https://investgame.net/wp-content/uploads/2025/03/0794a269-d5c4-4994-9bcf-8c5730d0815e_2025_GDC_State_of_the_Game_Industry_report-1.pdf
Meta Developers Blog (Mar 19, 2025): https://developers.meta.com/horizon/blog/gdc-2025-past-present-future-developing-vr-mr-meta-audience-insights/